The Lion's Den Vol. 13 - Peeling the Onion: Cohort Analysis
Performing a cohort analysis on SaasTours, a fictional ChatGPT-generated SaaS company
Cohort analysis is an indispensable tool for software investors in any due diligence effort. By dissecting data from various angles, this analysis can reveal trends and patterns that might otherwise be obscured and allow investors to see beyond surface-level metrics. Often, while companies' financials may appear compelling at a glance, when you start to “peel the onion” you can find valuable insights around where growth really comes from, how well a product resonates with different customer segments, which GTM strategies are working and which customer segments experience high churn.
In this post I will walk through a cohort analysis example of a fictional SaaS company in the travel space, which shall be named SaaSTours, completely made up by ChatGPT…
Let’s Go!
The Tale of a (Made Up) SaaS Company
Before diving in, an important disclaimer for all concerned GCs out there: no NDAs were violated in writing this post :)
Utilizing ChatGPT, I created a fictional SaaS company with dummy cohort data using directional prompts. As a side note, ChatGPT’s capabilities are remarkable. In my little microcosm of technology investing, activities like research, sourcing, benchmarking, analysis, valuation, content creation, etc. can be fundamentally transformed and superpowered by AI-based applications. Really looking forward to seeing more of these capabilities productized.
Let’s have a look at our fictional SaaSTours company and assume this company offers a data analysis software for hotels, airlines, tourist attraction and transportation companies worldwide and serves both large enterprises and small companies. After an initial discussion with management, we would usually get access to the aggregate numbers, which look quite attractive:
SaaSTours ended 2023 with $90M of ARR growing 69% YoY after experiencing multiple quarters of rapid growth. It has consistently increased its number of logos and ACV (Annual Contract Value) and has healthy retention metrics. Based on these metrics, SaaSTours would be considered an attractive company for most investors.
Data Cut I: Growth
As the next phase, we would ask for a detailed customer-by-customer breakdown including their main characteristics (vertical, geography, size, ACV, etc.) in order to dissect cohorts from different angles and uncover important trends.
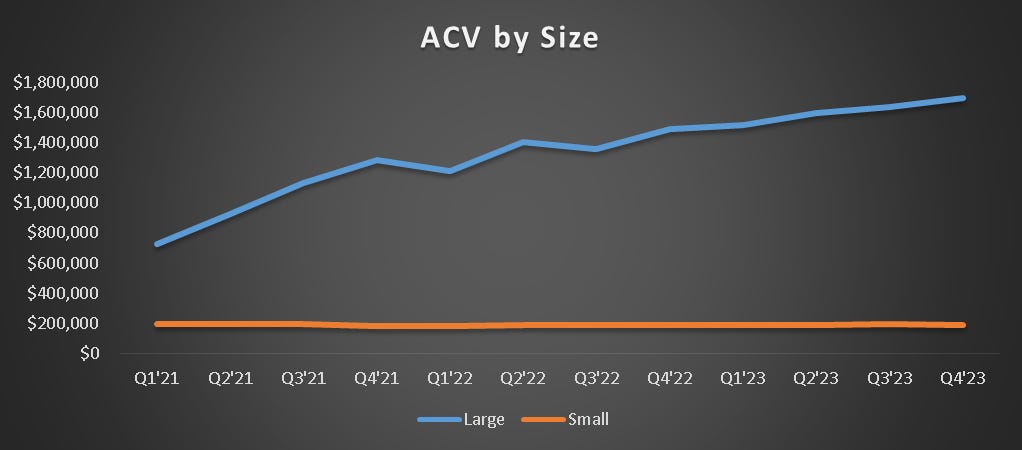
Let’s start with customer size. When breaking down ARR to large vs. small customers, there seems to be a meaningful difference between how these different segments contribute to growth. While SaaSTours has increased its ARR from $5M in Q1’21 to $90M in Q4’23 and its customer/logo count from 12 in Q1’21 to 88 in Q4’23, it seems that smaller logos aren’t scaling as well as large ones. Small customers join at a slower rate than larger ones, with their average ACV capped near $200k, whereas the enterprise avg. ACV has more than doubled between Q1’21-Q4’23.
A note of caution here: As you might have read in some of my previous posts, definitions matter. It’s worth understanding how a company defines “small” and “large” ARR and why. Some companies define customer segments arbitrarily (e.g. by # of employees, market cap, revenue potential, etc.) and 4-5 years later those definitions are obsolete. Re-defining customer segments and re-cutting the data could provide valuable insights.
The ACV/ARR trend for small customers is not necessarily a bad thing (after all, the avg. ACV is still quite high and the ARR is growing nicely), but this type of a finding would lead to a conversation with management to understand how different customers are acquired and serviced, how S&M costs are allocated and what churn looks like for each of these customer groups (we will come back to that).
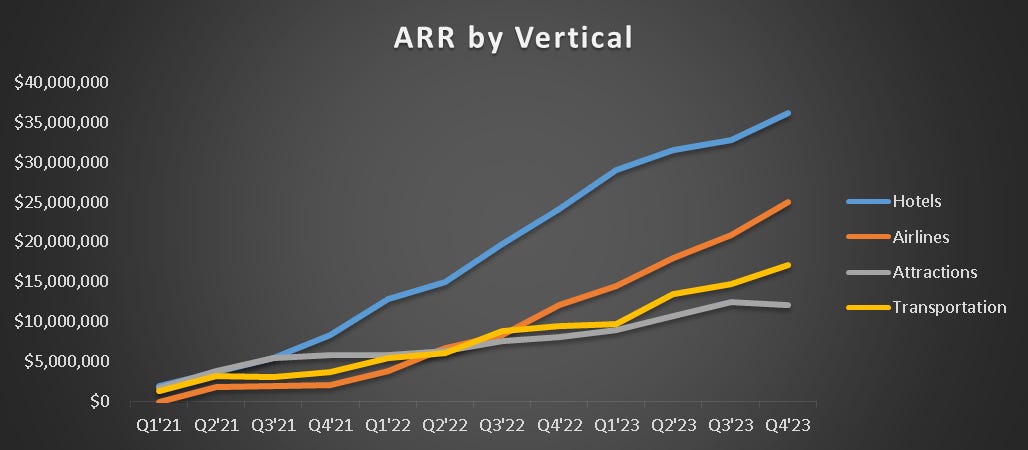
We also ran a few other cuts of the customer base to understand if there were other interesting trends based on different customer segments. The charts below illustrate that SaaSTours is seeing strong growth in the Hotels and Airlines verticals while the Attractions and Transportations verticals are growing much slower. The company is also growing much faster in North America than it is in EMEA and APAC. These findings add layers to the story and would, once again, lead to a more thorough conversation about strategy, TAM, competition and GTM approach for each of these verticals and regions.
Data Cut II: Churn / Retention
While ARR trends are obviously important, investors are really interested in that coveted combination of growth AND efficiency. In SaaS-land, the most important input and leading indicator for a company’s ability to scale efficiently is churn/retention. When retention is strong, it’s like jumping on a trampoline. When retention is weak, it’s like jumping in quicksand…
At a high level, SaaSTours has good retention metrics. High 80s/low 90s logo retention and ~115% NRR (Net Revenue Retention, i.e. the percentage of revenue retained from a cohort of existing customers after churn, upgrades, and downgrades) is pretty good, especially since SaaSTours serves both large and small customers. As an investor, if I can get conviction around that 115% number remaining stable, it means the company could grow 15%/yr before spending on new customer acquisition. This creates important flexibility in S&M expenses and a real ability to throttle growth and profitability as opposed to companies with 90-105% that have to constantly replenish their customer base with new customers.
Let’s start by looking at SaaSTours’ logo retention. To highlight important trends, we marked logo retention above 90% in green and below 85% in red. Like in many other companies, it seems that there are clear “green” areas of strong retention and clear “red” areas of high churn, but also a few intriguing trends. For example, Hotels and Airlines are the fastest growing verticals and both had terrific logo retention up until the last few quarters when retention started weakening. This would require a better understanding of whether this is a new trend the company can control or a more fundamental shift away from its products in those verticals. In each of these cases, we would try to understand why customers churn, what they replace SaasTours with, what the company did to prevent that churn and what retention-boosting efforts worked in other areas of the business that could be replicated.
Logo retention is, of course, just part of the picture. A SaaS company’s ability to continuously monetize its existing customer base through pricing, product upsells and cross-sell initiatives is key and can be best assessed when looking at NRR trends. To highlight important trends, we marked NRR above 115% in green and below 105% in red.
This analysis reveals that Hotels and Airlines segments exhibit a strong NRR despite the recent logo churn concern. This could indicate that SaaSTours has solid pricing leverage or that it is able to prove value and expand efficiently within those verticals. On the other hand, the Transportation NRR seems to be declining in the last few quarters despite the vertical’s strengthening logo retention. This might mean that certain customers are not seeing enough value and are therefore downgrading or that price sensitivity in that vertical is higher. The Attractions vertical has both poor logo retention and net retention, which should raise questions about the viability of serving that vertical going forward.
On the size front, there is a clear delineation in retention between large and small customers, which is not surprising. In a situation like this, we would carefully consider whether or not SaaSTours should serve small customers and at what cost structure. If enterprise is clearly the winning strategy, then serving small customers should probably be managed with mostly PLG (Product-Led Growth) marketing, low-touch onboarding and little customer support. Given that large customers generate ~92% of SaasTours’ ARR, we would probably only keep the small customers business if it was highly profitable or if it served as an efficient lead nourishment engine for larger customers. Sales and customer care operations dedicated to small customers would be looked at as a cost saving opportunity in this case.
On the geo front, SaaSTours seems to have a problem in APAC, where retention is very low. We would try to understand the cause (competition, pricing, lack of “health checks”, etc.), but in all likelihood make the decision to exit this territory as it seems to be a leaky bucket. Without APAC, not only will SaaSTours’ overall NRR look better, but management could also allocate more resources to North America and EMEA where retention and growth are better.
Concluding Thoughts
Although fairly basic, this analysis uncovered significant insights. When we peeled the onion from what seemed like strong unit economics, we discovered clear areas of weakness and opportunities that one could build an investment thesis around. While the analysis can be much deeper and more complex, I try very hard to not get bogged down in an infinite matrix of charts, but rather find meaningful enough trends that I can understand, ask smart questions about and build a strong investment thesis around.
Onwards!


Omer - this is very good! Very entertaining and insightful read. Thanks for sharing and for putting the time to do this. I hope all is well.